Cycle No. 01 · Narrative
Ibn Khaldun — dynastic cycle
~120-year cycle of dynastic rise and fall, driven by asabiyyah - the group cohesion that hardship builds and luxury dissolves. Khaldun's five stages, paraphrased from Rosenthal: consolidation → concentration of power → leisure → contentment → waste
Does it hold up?
Not testable on the record that exists — and that is the finding, not a dodge.
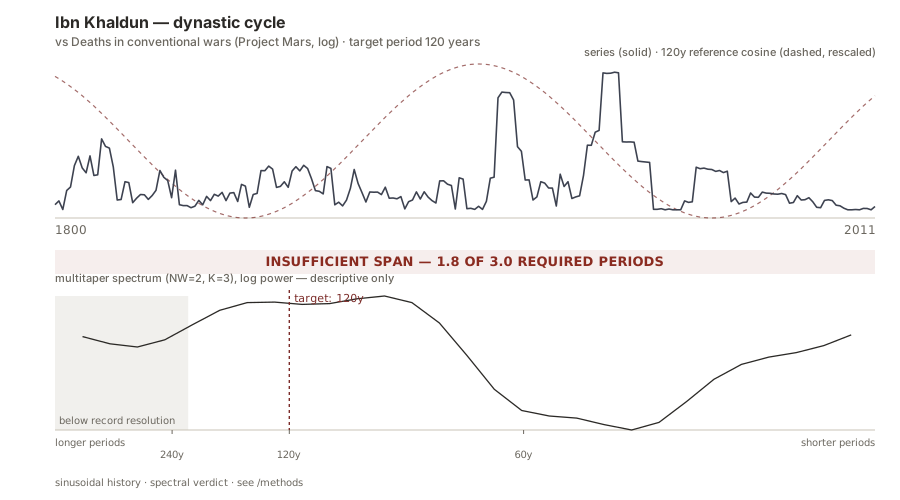
The paired record (Deaths in conventional wars (Project Mars, log)) runs 211 years: 1.8 of the 3.0 full periods this site requires before it will run a test on a 120-year claim. Roughly 149 more years of that measurement would reach the floor.
This is not a verdict about this theory in particular: 0 of the 9 paired constructions on this site clear that floor. Long-cycle claims are hard to test because the records are short, not because the theorists are careless.
- Period
- 120 years
- Reference peak
- 1789
- Paired data
- Conflict deaths · log
Peak calibration
Project's editorial choice. Anchoring at the French Revolution places the curve at a documented Western inflection point so it can be visually compared against the modern US and global data series this project carries. Khaldun (d. 1406) made no claim about European history; this is the framework being applied here, not extended by him.
Confidence classification: Narrative — an interpretive reading of history — no statistical fitting behind the period. Every cycle on this site is a pure sinusoid built from the theory's stated period and one documented reference peak — a deliberately naïve construction, so that disagreement between theories rather than parameter fitting is what you see. See about for why nearly every cycle peaks near the present.
Where this curve plots its extrema
Computed from period 120 and reference peak 1789, across the site's default window (1600–2050). These are positions of this construction, not dates claimed by the theorist.
- Peaks
- 1669 · 1789 · 1909 · 2029
- Troughs
- 1609 · 1729 · 1849 · 1969
Paired data series
Deaths in conventional wars (Project Mars, log)
deaths per 100,000Natural log of (1 + deaths per 100,000) from Project Mars - log-transformed to keep WWI/WWII from flattening the rest of the series. Coverage 1800–2011; Project Mars covers conventional interstate and civil wars between states with differentiated militaries causing ≥500 deaths
Why this pairingRough proxy for Khaldun-style state-breakdown intensity. Log-transformed because WWI/WWII spikes otherwise dominate; the transform reveals secular trend and lets the cycle pairing breathe.
Values are log1p-transformed at load time — natural log of (1 + value).
- Source
- Our World in Data · Project Mars v1.1 (Lyall 2020)
- License
- OWID chart CC BY 4.0; underlying Project Mars data Public Domain (Harvard Dataverse)
Spectral verdict
Insufficient data — no test possible · 1.8 of 3.0 required periods
The Deaths in conventional wars (Project Mars, log) record spans 211 years — 1.8 of the 3.0 full periods this site requires before testing a 120-year claim. No test was run and no p-value exists: the honest verdict is that the record is too short to test the claim at all.
INSUFFICIENT_DATA is an eligibility outcome under the site's pre-registered 3.0-period rule - the test is declined, not failed - and is not evidence for or against the theory.
Pre-registered harmonic-regression test at the exact stated period against an AR(1) red-noise null (99,999 bootstrap draws), gated on the record covering at least 3.0 full periods. Read the protocol under spectral testing on the methods page, or fetch the machine-readable verdicts.json.
Reuse this
Kooi, D. (2026). Sinusoidal History: Ibn Khaldun — dynastic cycle. https://sinusoidalhistory.com/cycles/khaldun · DOI 10.5281/zenodo.21998618. Paired data series: Deaths in conventional wars (Project Mars, log) (Our World in Data · Project Mars v1.1 (Lyall 2020)), OWID chart CC BY 4.0; underlying Project Mars data Public Domain (Harvard Dataverse).
Our code and the original chart files are MIT-licensed as our own work. The plotted data stay under their upstream terms, listed above: CC BY series carry their attribution requirement with them, and a series with no explicit license is shown here without any grant we can pass on. Reuse our figures and code with attribution; honour the data terms for the plotted series.
Open this cycle in the interactive chart to calibrate its peak and period against the data, or compare it with the other nine on one axis.