Cycle No. 05 · Empirical · contested
Carlota Perez — techno-economic paradigm
~50–60 year wave in how each technological revolution is absorbed: installation (finance chases the new technology into a bubble) → turning point (the crash) → deployment (the technology actually spreads - the golden age)
Does it hold up?
Not testable on the record that exists — and that is the finding, not a dodge.
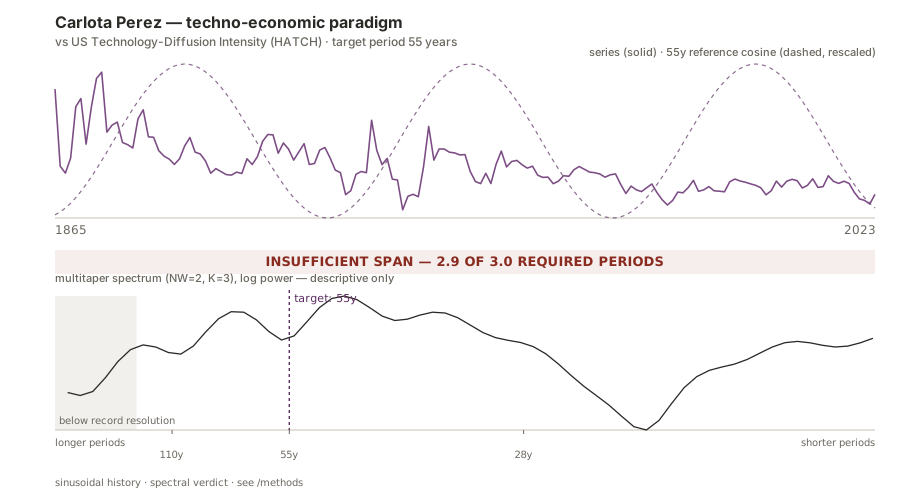
The paired record (US Technology-Diffusion Intensity (HATCH)) runs 158 years: 2.9 of the 3.0 full periods this site requires before it will run a test on a 55-year claim. Roughly 7 more years of that measurement would reach the floor.
This is not a verdict about this theory in particular: 0 of the 9 paired constructions on this site clear that floor. Long-cycle claims are hard to test because the records are short, not because the theorists are careless.
- Period
- 55 years
- Reference peak
- 2000
- Paired data
- Tech diffusion · site-derived
Peak calibration
Anchored to Perez's 'Turning Point' (2000–2001), the dot-com crash she identifies as the inflection between Installation and Deployment phases of the ICT surge. Her own term is 'turning point,' not peak; we map it to the sinusoid's peak as a mathematical convenience. Read 2000 as the financial-frenzy peak that ends the Installation phase, not a claimed 'paradigm peak' - and note that Perez's 2009 'double bubble' paper treats the dot-com crash and the 2008 credit crash as two parts of one structural episode, which makes any single-year Turning Point a stylization.
Confidence classification: Empirical · contested — an empirical literature exists on the claim, and it is disputed. Every cycle on this site is a pure sinusoid built from the theory's stated period and one documented reference peak — a deliberately naïve construction, so that disagreement between theories rather than parameter fitting is what you see. See about for why nearly every cycle peaks near the present.
Where this curve plots its extrema
Computed from period 55 and reference peak 2000, across the site's default window (1600–2050). These are positions of this construction, not dates claimed by the theorist.
- Peaks
- 1615 · 1670 · 1725 · 1780 · 1835 · 1890 · 1945 · 2000
- Troughs
- 1643 · 1698 · 1753 · 1808 · 1863 · 1918 · 1973 · 2028
Paired data series
US Technology-Diffusion Intensity (HATCH)
z-score (median)Experimental, site-derived composite from HATCH 2.0 national adoption series - not a measure published by the HATCH authors: the median, across ~105 US technology series, of within-technology z-scored 5-year log-changes in adoption; annual 1865–2023, with the contributing-technology count published per year
Why this pairingPerez's construct is economy-wide diffusion and deployment of a techno-economic paradigm - not asset prices - so a diffusion composite is the nearest measurable analogue public long-run data allows. Read it with its construction in view: each technology is standardized against its own full history, so S-curve maturity is built into the score, and the persistent negativity after the 1970s is substantially an artifact of that normalization and of an aging panel, not evidence that real diffusion slowed. The transform contains no Perez dates, period, or phase parameters (the build script is committed for audit), and the result is visible on the chart: no local peak at 2000.
- Source
- HATCH - Extended Historical Adoption of Technology Dataset 2.0 (Greene & Nemet, U. Wisconsin–Madison), Zenodo, DOI 10.5281/zenodo.19579793
- License
- CC BY 4.0
Spectral verdict
Insufficient data — no test possible · 2.9 of 3.0 required periods
The US Technology-Diffusion Intensity (HATCH) record spans 158 years — 2.9 of the 3.0 full periods this site requires before testing a 55-year claim. No test was run and no p-value exists: the honest verdict is that the record is too short to test the claim at all.
INSUFFICIENT_DATA is an eligibility outcome under the site's pre-registered 3.0-period rule - the test is declined, not failed - and is not evidence for or against the theory.
Pre-registered harmonic-regression test at the exact stated period against an AR(1) red-noise null (99,999 bootstrap draws), gated on the record covering at least 3.0 full periods. Read the protocol under spectral testing on the methods page, or fetch the machine-readable verdicts.json.
Reuse this
Kooi, D. (2026). Sinusoidal History: Carlota Perez — techno-economic paradigm. https://sinusoidalhistory.com/cycles/perez · DOI 10.5281/zenodo.21998618. Paired data series: US Technology-Diffusion Intensity (HATCH) (HATCH - Extended Historical Adoption of Technology Dataset 2.0 (Greene & Nemet, U), CC BY 4.0.
Our code and the original chart files are MIT-licensed as our own work. The plotted data stay under their upstream terms, listed above: CC BY series carry their attribution requirement with them, and a series with no explicit license is shown here without any grant we can pass on. Reuse our figures and code with attribution; honour the data terms for the plotted series.
Open this cycle in the interactive chart to calibrate its peak and period against the data, or compare it with the other nine on one axis.