Cycle No. 08 · Narrative
Strauss-Howe — saeculum
~80–90 year saeculum - about one long human life - in four ~21-year turnings driven by generational replacement: high → awakening → unraveling → crisis (the 4th turning)
Does it hold up?
Not testable on the record that exists — and that is the finding, not a dodge.
The paired record (US Liberal Democracy Index (V-Dem)) runs 236 years: 2.8 of the 3.0 full periods this site requires before it will run a test on a 84-year claim. Roughly 16 more years of that measurement would reach the floor.
This is not a verdict about this theory in particular: 0 of the 9 paired constructions on this site clear that floor. Long-cycle claims are hard to test because the records are short, not because the theorists are careless.
- Period
- 84 years
- Reference peak
- 1955
- Paired data
- V-Dem libdem index
Peak calibration
Anchored to the post-WWII American High (~1955), the most recent completed First Turning peak in Strauss-Howe's saeculum. With period 84, the trough of this construction lands at 1997 (1955 + 42) and the next peak at 2039; the predicted Fourth-Turning Crisis climax (~2020) therefore sits on the rising arm of the sinusoid (cos ≈ +0.15), neither at a trough nor a peak. The framework actually has two cultural highs per saeculum (the 1T High and the 2T Awakening), so reducing it to a single sinusoid is a forced choice; we use the structural High. There is no peak-year anchor that aligns the predicted Crisis climax with either a sinusoid peak or trough.
CaveatGenerational theory is contested in academic history. The single-sinusoid representation is a forced reduction of a four-turnings model. Treat skeptically.
Confidence classification: Narrative — an interpretive reading of history — no statistical fitting behind the period. Every cycle on this site is a pure sinusoid built from the theory's stated period and one documented reference peak — a deliberately naïve construction, so that disagreement between theories rather than parameter fitting is what you see. See about for why nearly every cycle peaks near the present.
Where this curve plots its extrema
Computed from period 84 and reference peak 1955, across the site's default window (1600–2050). These are positions of this construction, not dates claimed by the theorist.
- Peaks
- 1619 · 1703 · 1787 · 1871 · 1955 · 2039
- Troughs
- 1661 · 1745 · 1829 · 1913 · 1997
Paired data series
US Liberal Democracy Index (V-Dem)
index 0–1V-Dem liberal-democracy index for the US, 1789–2025, scale 0–1
Why this pairingGenerational-cycle theory predicts crisis lows that line up with stress on liberal-democratic institutions. V-Dem's recent US drop is the clearest empirical analogue to Strauss-Howe's 'Fourth Turning'.
- Source
- V-Dem Institute, Country-Year Dataset v16, March 2026 (retrieved via Our World in Data)
- License
- CC BY-SA 4.0
Spectral verdict
Insufficient data — no test possible · 2.8 of 3.0 required periods
The US Liberal Democracy Index (V-Dem) record spans 236 years — 2.8 of the 3.0 full periods this site requires before testing a 84-year claim. No test was run and no p-value exists: the honest verdict is that the record is too short to test the claim at all.
INSUFFICIENT_DATA is an eligibility outcome under the site's pre-registered 3.0-period rule - the test is declined, not failed - and is not evidence for or against the theory.
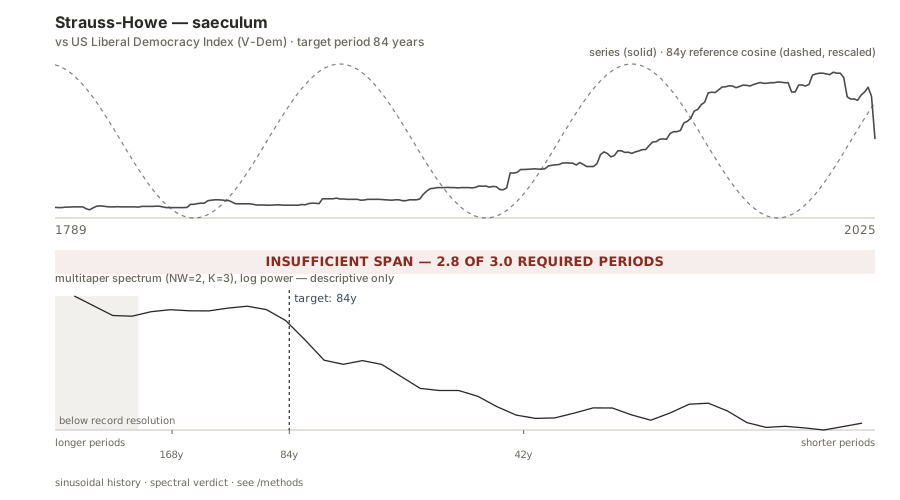
Pre-registered harmonic-regression test at the exact stated period against an AR(1) red-noise null (99,999 bootstrap draws), gated on the record covering at least 3.0 full periods. Read the protocol under spectral testing on the methods page, or fetch the machine-readable verdicts.json.
Reuse this
Kooi, D. (2026). Sinusoidal History: Strauss-Howe — saeculum. https://sinusoidalhistory.com/cycles/strauss-howe · DOI 10.5281/zenodo.21998618. Paired data series: US Liberal Democracy Index (V-Dem) (V-Dem Institute, Country-Year Dataset v16, March 2026 (retrieved via Our World in Data)), CC BY-SA 4.0.
Our code and the original chart files are MIT-licensed as our own work. The plotted data stay under their upstream terms, listed above: CC BY series carry their attribution requirement with them, and a series with no explicit license is shown here without any grant we can pass on. Reuse our figures and code with attribution; honour the data terms for the plotted series.
Open this cycle in the interactive chart to calibrate its peak and period against the data, or compare it with the other nine on one axis.